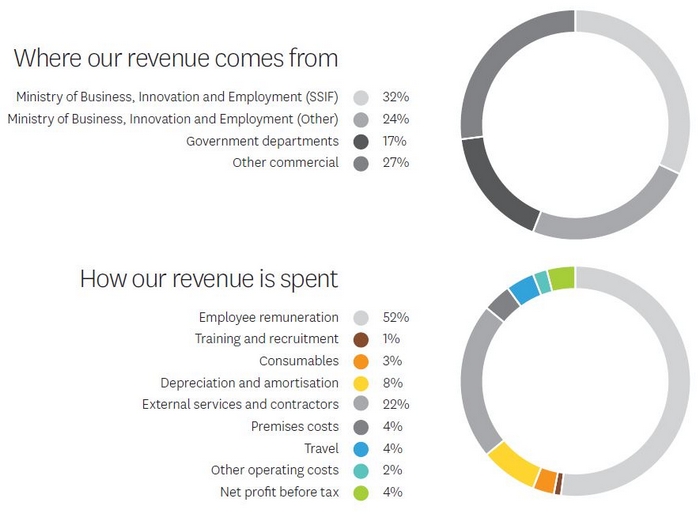
Financial results summary
| 2017 Actual | 2018 Actual | 2019 Budget | 2019 Actual | |
|---|---|---|---|---|
| Revenue, $m | 51.90 | 56.74 | 59.17 | 55.94 |
| EBIT, $m | 3.01 | 3.03 | 2.09 | 1.88 |
| EBIT Margin | 5.8% | 5.3% | 3.5% | 3.4% |
| Reinvestment, $m | 1.37 | 1.43 | 1.10 | 1.12 |
| EBIT-R, $m | 4.38 | 4.46 | 3.19 | 3.00 |
| EBIT-R Margin | 8.4% | 7.9% | 5.4% | 5.4% |
| Total Assets, $m | 54.20 | 57.13 | 56.48 | 55.25 |
| Return on Equity | 6.2% | 5.7% | 4.0% | 3.9% |
| Re-investment Return on Equity | 8.7% | 8.2% | 5.9% | 5.7% |
| Equity Ratio | 73.5% | 71.6% | 75.2% | 74.5% |
| Dividend, $m | - | - | - | - |
| Gearing | 0.0% | 0.0% | 0.0% | 0.0% |
Revenue: Includes science research, contract work for government and commercial clients, royalties and licence
fees.
EBIT: Earnings before interest, tax and restructuring costs.
EBIT Margin: EBIT ÷ revenue.
EBIT-R: EBIT before reinvestment where reinvestment are amounts approved by the Minister.
EBIT-R Margin: EBIT-R ÷ revenue.
Return on equity: Net profit after tax ÷ average shareholders’ funds, expressed as a percentage.
Equity Ratio: Average shareholders’ funds ÷ average total assets.
Gearing: Financial debt ÷ financial debt plus shareholders’ funds.
(The Minister of Finance and the Minister of Science and Innovation each hold 50% of the shares on behalf of the public.)

Our full Reports and Financial Statements are presented in Part B of the Annual Report.
