Smoke signals: Critical modelling tool in Scion’s belt
Where there’s fire, there’s smoke and Scion modelling can show you where it might go.
When large fires break out in New Zealand, like on Christchurch’s Port Hills, or when Australian wildfires cause New Zealand’s skies to turn pink and orange, Scion staff have an important job.
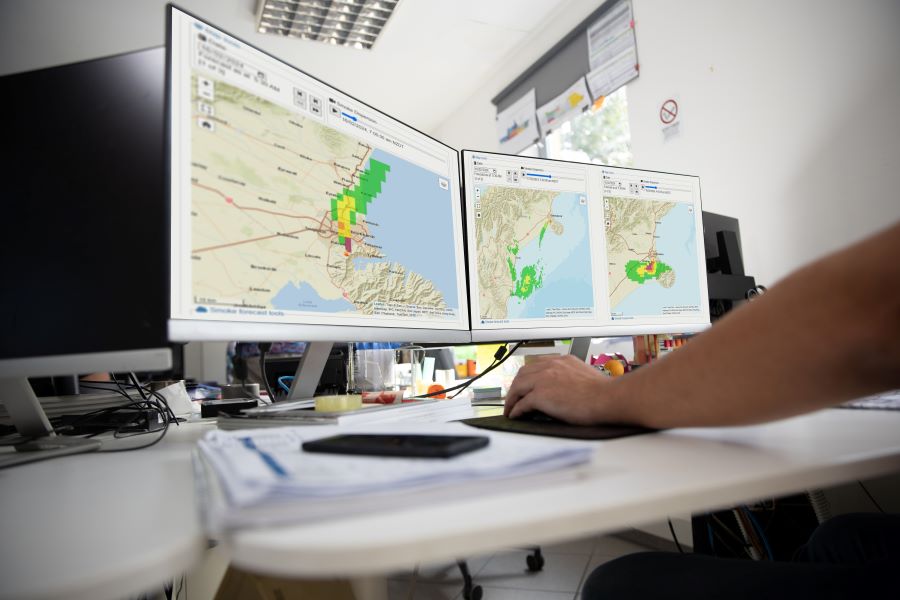
Scion’s automatic and manual smoke forecast modelling can inform health authorities’ decisions and advice by forecasting smoke locations and fine particulate concentrations. The smoke forecast is published in a modelling prototype on Scion’s website.
The automatic modelling is done using satellite detected fire hotspots and forecasted weather, which together are used to generate potential fire size, smoke emissions and downwind particulate concentrations. This smoke footprint shows hourly PM2.5 concentrations — concentrations of particles less than 2.5 micrometers in diameter. It is these small particles that can travel into the body when inhaled and affect human health. High concentrations of particulate matter can also affect visibility.
But automatic modelling has some flaws. Satellites pass over in four-hour intervals and clouds affect visibility which can reduce the number of hotspots detected. Automatic models are also built on assumptions that may not suit all situations. So, Scion’s Fire and Atmospheric Team also runs the system manually upon request, for example by Fire and Emergency New Zealand. Scion initiated manual modelling when the Port Hills in Ōtautahi Christchurch caught fire in February. This allowed informed communication around smoke impacts, including where hotspots were not detected due to cloud cover.
For the Port Hills fire smoke modelling identified locations where smoke and fine particulate concentrations could be predicted to drift over Christchurch. Smoke forecasts were produced daily showing where smoke could be hazardous over the next 48 hours if the fire continued. Qualitative results were accurate in showing the direction of smoke movement early.
This modelling can inform Fire and Emergency, health authorities and the public, project leader Shana Gross says. “The purpose is to provide data that assists in decision making around smoke impacts. This could range from poor visibility over roads to health effects. For example, health authorities could use the data to provide advice on what to do based on projected smoke concentrations.”
This advice could include staying inside, shutting windows, or evacuating.
The modelling system forecasts smoke from fires both here and eastern Australia. Forests and Landscapes general manager, Tara Strand, says smoke can have far-reaching effects. “Smoke affects many people and can impact many kilometres downwind... A member of the community can use this tool to build an understanding of timing and levels of smoke exposure.”
While the smoke forecasts are still a prototype, Scion endeavours to keep them up to date, particularly during wildfire season. It is important to recognise, that in any model the outputs have uncertainty and error and while the team strives to minimise both of these, the prototype is still undergoing testing and evaluation.
New Zealand’s wildfire season runs from October to May with the highest risk from January to March.